I'm Edil Baiyzbekov
An award winning full stack data journalist👨🏽💻
I’m exploring new ways of telling stories with code in digital spaces.
baiyzbekov.edil@gmail.comUse arrow keys or tap below to navigate
My stack
I love to experiment with visual storytelling, so my technology stack goes beyond 🐍. I use C#, Unity game engine and AR technologies for immersive projects.
I can scrape, clean and analyze data with Python. I also use it to automate scripts and experiment with ML.
After that I make dope visualizations with JavaScript, D3 and other libraries.
I worked at UNICEF Office of Innovation, Radio Free Europe/Radio Liberty, Texty.org.ua, Kloop Media and collaborated with several NGOs.
Tap right to see what technologies I have used in my projects👨🏽💻.
Project 1 : Unity simulation
Stack: JavaScript, D3, Svelte, react, TypeScript, mapbox, node, scrollama, html, css, archieML.
Python, pandas, selenium, bs4, numpy, asyncio, keras, scikit-learn.
C#, Unity, DOTS, WebGL, Tiny.
QGIS, Spark AR, Tableau, flourish, datawrapper, SQL, spreadsheets, git, figma, adobe Illustrator, blender, adobe premiere.
Ok, enough talking, tap below to see my stack in action!🚀
Project 1
The idea for this project came from a realization about how difficult it might be for a reader to really process the number of deaths caused by COVID-19. Graphs and tables just can’t communicate the severity of the problem or approach it from a humane position. I made a WebGL 3D simulation of Kyiv’s city center with Unity Game Engine, C# and JS. You can change the number of people, walk among them and see the crowded streets from the bird’s-eye view.
Project 2
Project 1
How Kyrgyz parliament copy-pasted russian laws.
👨🏽💻 Python, JS, html, flourish
🏅 Top-10 by GIJN
Project 3 : femicide
Project 1
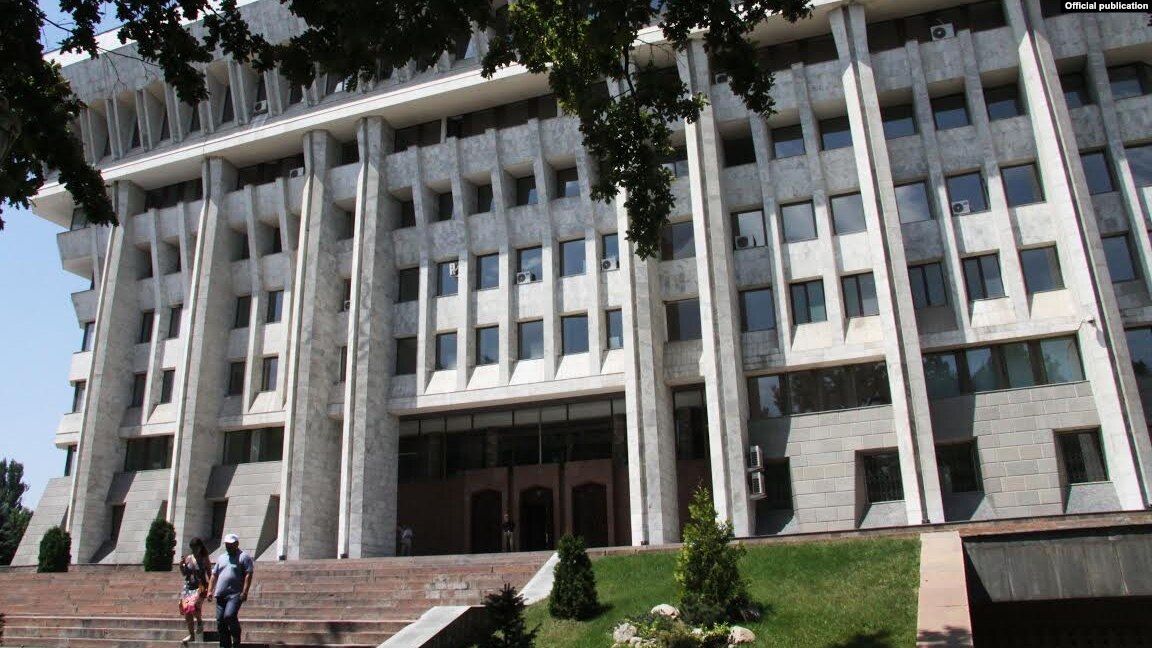
I scraped and analyzed all bills of the 6th Kyrgyz parliament and found that about 40% of them have similarities with Russian bills. 17 bills were almost complete copies of Russian laws.
I designed this project in Instagram-story format using JS, html, css and flourish animated charts. It was also featured in a top-10 data stories rating by GIJN🎉.
Project 3
Project 2
“I would have killed her anyway”. Investigation of femicide in Kyrgyzstan

👨🏽💻 Python, Selenium, asyncio
🏅 Winner of the Sigma Awards 2021
Project 4 : D3js
Project 2
This project is a winner of the international data journalism competition The Sigma Awards 2021 🎉. There are no publicly available official statistics on women’s murders in Kyrgyzstan. So I scraped more than 54000 criminal news articles to understand the femicide patterns in Kyrgyzstan. We identified around 80 words and sentences in accordance with femicide criteria. Then I created a Python script that converts them into flexible regex patterns to fit the complex structures of the Russian language. It let me find more than 3000 news and press releases that covered the women’s murders.
Project 4
Project 3
How Kyrgyz parliamentarians change their political parties.
👨🏽💻 Python, JS, D3, scrollama
🏅 Top-10 by GIJN
Project 5 : Mapbox
Project 3
Members of Kyrgyzstan’s parliament often choose their political party by how well its agenda aligns with their personal goals rather than their political values. This results in representatives frequently moving to parties that better suit their private interests, even if their agenda is opposite to their previous union’s program. I analyzed the composition of the six Kyrgyz parliaments and visualized this process using D3 and scrollytelling. This project got in top-10 data stories rating by GIJN🎉
Project 5
Project 4
I created an interactive, easy-to-edit and rich dashboard that shows where open source tech solutions for good are deployed, developed, and which Sustainable Development Goals they achieve in each country. I built this project with NextJS, React, Mapbox GL and scrollama. Digital public goods are open source software, open data, AI, standards, and content that digitally harmless, and relevant to UN’s 2030 Sustainable Development Goals.
Project 6
Project 6
A telegram bot for victims of domestic violence to safely ask for help.
👨🏽💻 Python, MongoDB, Heroku
🏅 Winner of the UN hackathon
Other projects :
Project 6
This telegram bot helps women to recognize signs of domestic violence, gives them information on how to protect themselves and connects them to the nearest crisis centers. My team developed bot at the UN hackathon. We have won the 🏅1st place in the competition.
Other projects
How Kyrgyz parliament members violate regulations and pass laws without a quorum.
I scraped, cleaned and analyzed protocols of meetings for this investigation.
